
Dashboard
从L版本开始,Ceph 提供了原生的Dashboard功能,通过Dashboard对Ceph集群状态查看和基本管理。
使用Dashboard需要在MGR节点安装软件包:
yum install ceph-mgr-dashboard –y
如果是按课程用的O版本会出现下面缺少依赖包提示:
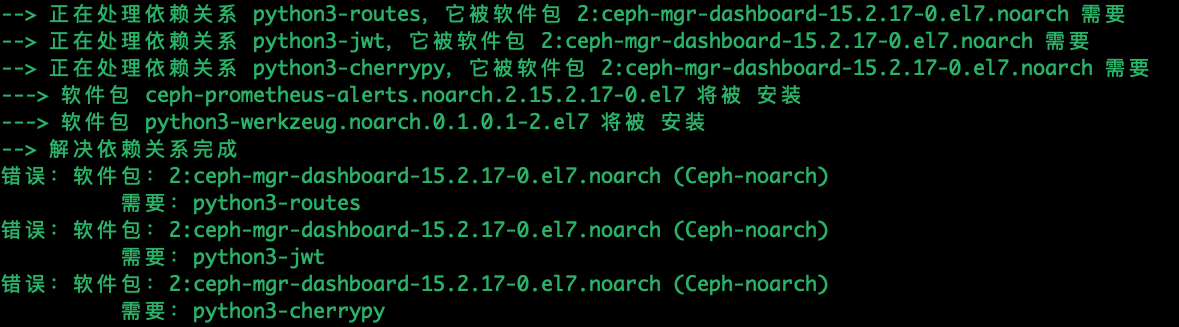

原因分析:这是由于从O版本开始,MGR改为Python3编写,而默认库没有这3个模块包,即使单独找包安装也可能不生效或者安装不上。从社区得知,这是已知问题,建议使用CentOS8系统或者使用cephadm容器化部署Ceph。
或者降低Ceph版本也可以,例如H版本,这个版本还是Python2编写的,不存在缺包问题。
这里选择降低到H版本,重新部署Ceph集群。
1、清理Ceph集群环境
# 从远程主机卸载ceph包并清理所有数据
ceph-deploy purge ceph-node01 ceph-node02 ceph-node03
# 清理ceph所有数据(/var/lib/ceph)
ceph-deploy purgedata ceph-node01 ceph-node02 ceph-node03
# 从本地目录移出认证秘钥(my-cluster目录),可选
ceph-deploy forgetkeys

# 需要登录到所有节点执行:
# 彻底清理ceph相关软件包
rpm -qa |grep 15.2.17 |xargs -i yum remove {} -y
# 取消OSD盘创建的LVM逻辑卷映射关系
dmsetup info -C |awk '/ceph/{print $1}' |xargs -i dmsetup remove {}
# 清除OSD盘GPT数据结构
yum install gdisk -y
sgdisk --zap-all /dev/sdb
# sgdisk --zap-all /dev/sdc
2、与之前部署方式一样
cat > /etc/yum.repos.d/ceph.repo << EOF
[Ceph]
name=Ceph packages for $basearch
baseurl=http://mirrors.aliyun.com/ceph/rpm-nautilus/el7/\$basearch
gpgcheck=0
[Ceph-noarch]
name=Ceph noarch packages
baseurl=http://mirrors.aliyun.com/ceph/rpm-nautilus/el7/noarch
gpgcheck=0
[ceph-source]
name=Ceph source packages
baseurl=http://mirrors.aliyun.com/ceph/rpm-nautilus/el7/SRPMS
gpgcheck=0
EOF

ceph-deploy new ceph-node01 ceph-node02 ceph-node03
ceph-deploy install --no-adjust-repos ceph-node01 ceph-node02 ceph-node03
ceph-deploy mon create-initial
ceph-deploy admin ceph-node01 ceph-node02 ceph-node03
ceph-deploy osd create --data /dev/sdb ceph-node01
ceph-deploy osd create --data /dev/sdb ceph-node02
ceph-deploy osd create --data /dev/sdb ceph-node03
ceph osd tree

ceph-deploy mgr create ceph-node01 ceph-node02 ceph-node03
3、添加RBD块设备和CephFS文件系统测试
# 添加RBD块设备:
ceph osd pool create rbd-pool 128
ceph osd pool application enable rbd-pool rbd
rbd create --size 10240 rbd-pool/image01
rbd map rbd-pool/image01
mkfs.xfs /dev/rbd0
mount /dev/rbd0 /mnt

# 添加CephFS文件系统:
ceph-deploy mds create ceph-node01 ceph-node02 ceph-node03
ceph osd pool create cephfs_data 64
ceph osd pool create cephfs_metadata 64
ceph fs new cephfs cephfs_metadata cephfs_data
mount -t ceph 192.168.1.13:6789,192.168.31.1:14,192.168.31.1:15:/ /mnt -o name=admin,secret=XXXXXXXXXXXXXXXXX==
安装dashboard
# 1、在每个MGR节点安装
yum install ceph-mgr-dashboard –y
# 2、开启MGR功能
ceph mgr module enable dashboard
# 3、修改默认配置
ceph config set mgr mgr/dashboard/server_addr 0.0.0.0
ceph config set mgr mgr/dashboard/server_port 7000
ceph config set mgr mgr/dashboard/ssl false
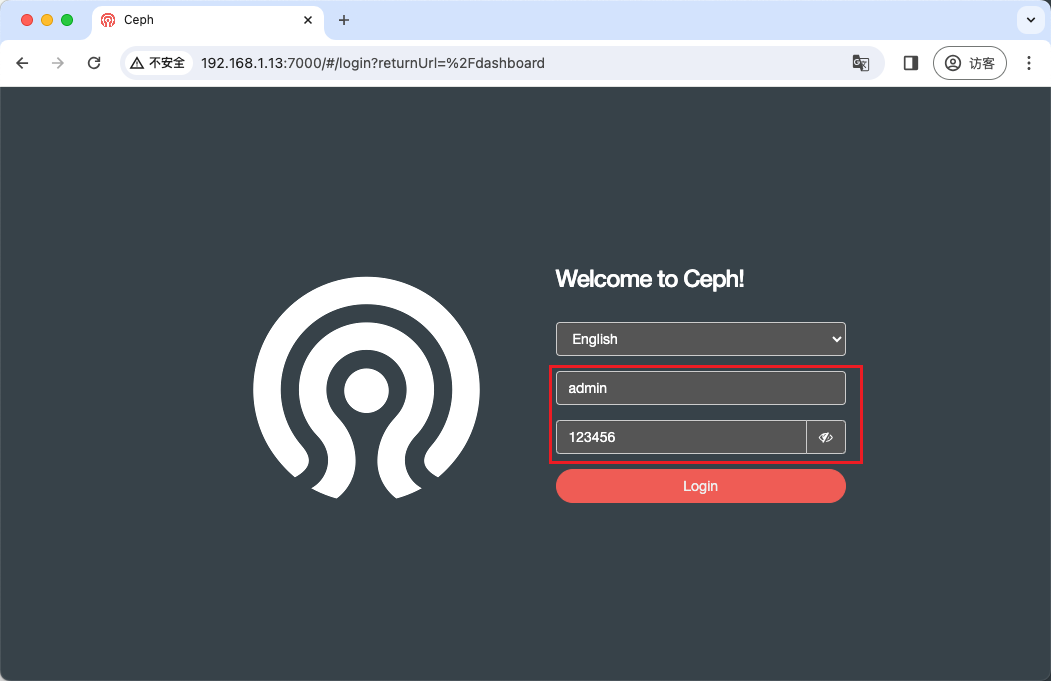
# 4、创建一个dashboard登录用户名密码
# 格式:dashboard ac-user-create <username> {<rolename>} {<name>}
ceph dashboard ac-user-create admin administrator -i password.txt
# 5、查看服务访问方式
ceph mgr services
# 后面如果修改配置,重启生效:
ceph mgr module disable dashboard
ceph mgr module enable dashboard
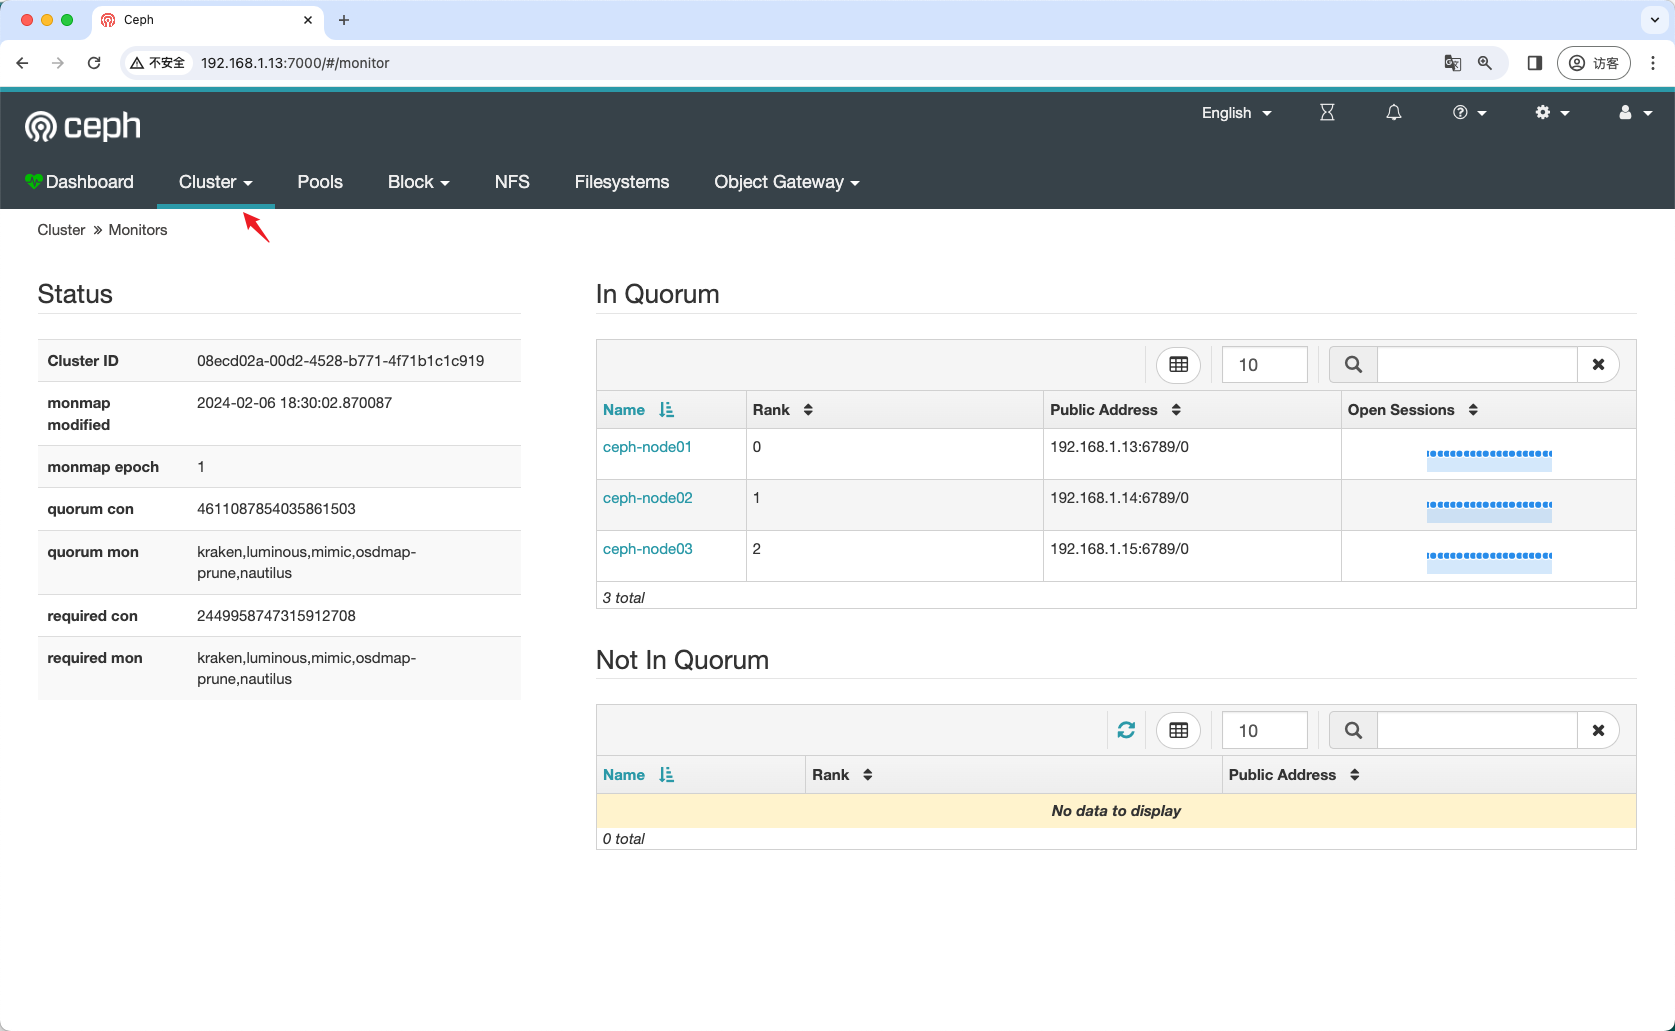
dashboard主界面

第二部分是host相关信息
硬盘及读写情况

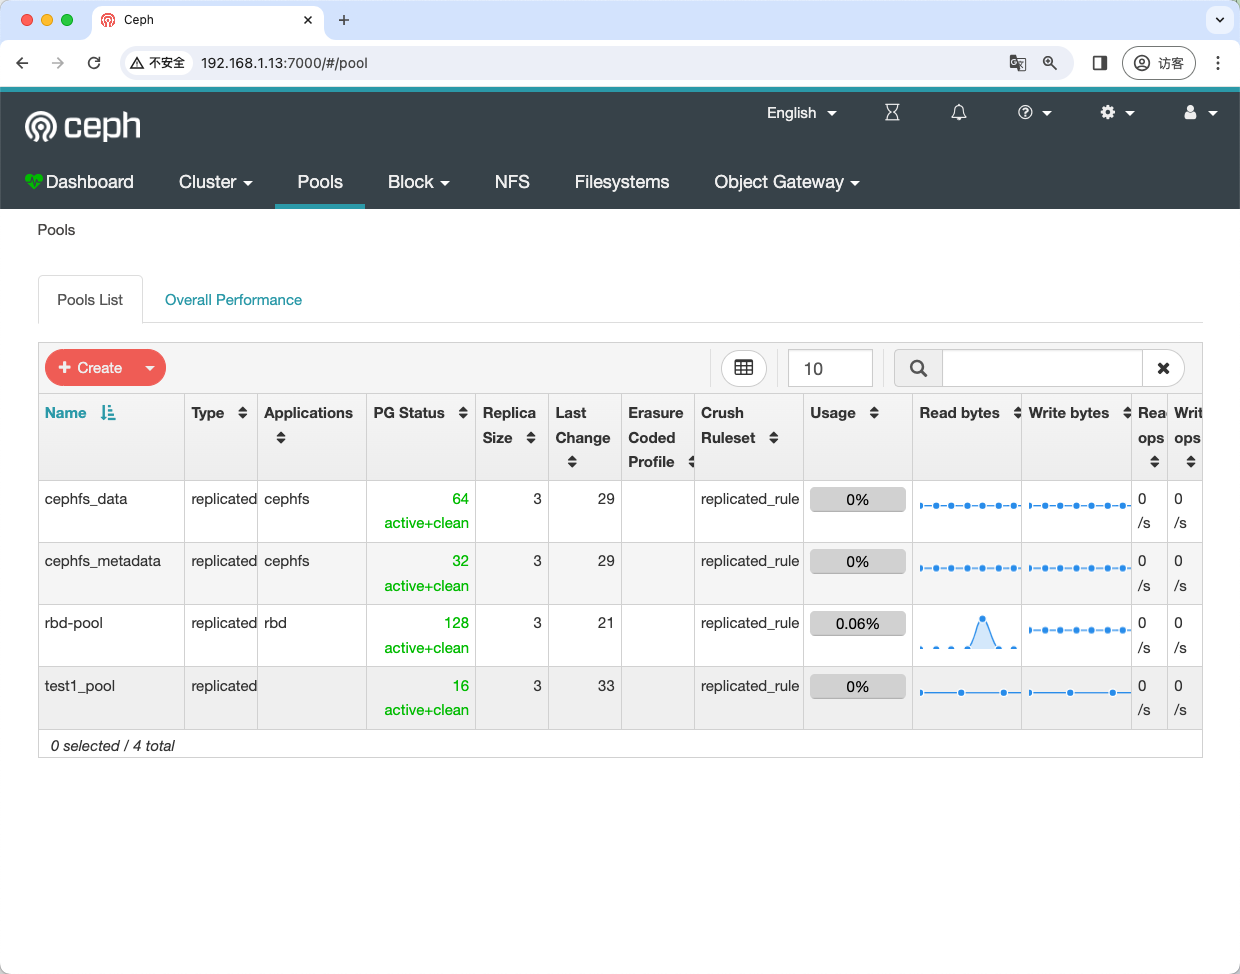
Pool相关信息
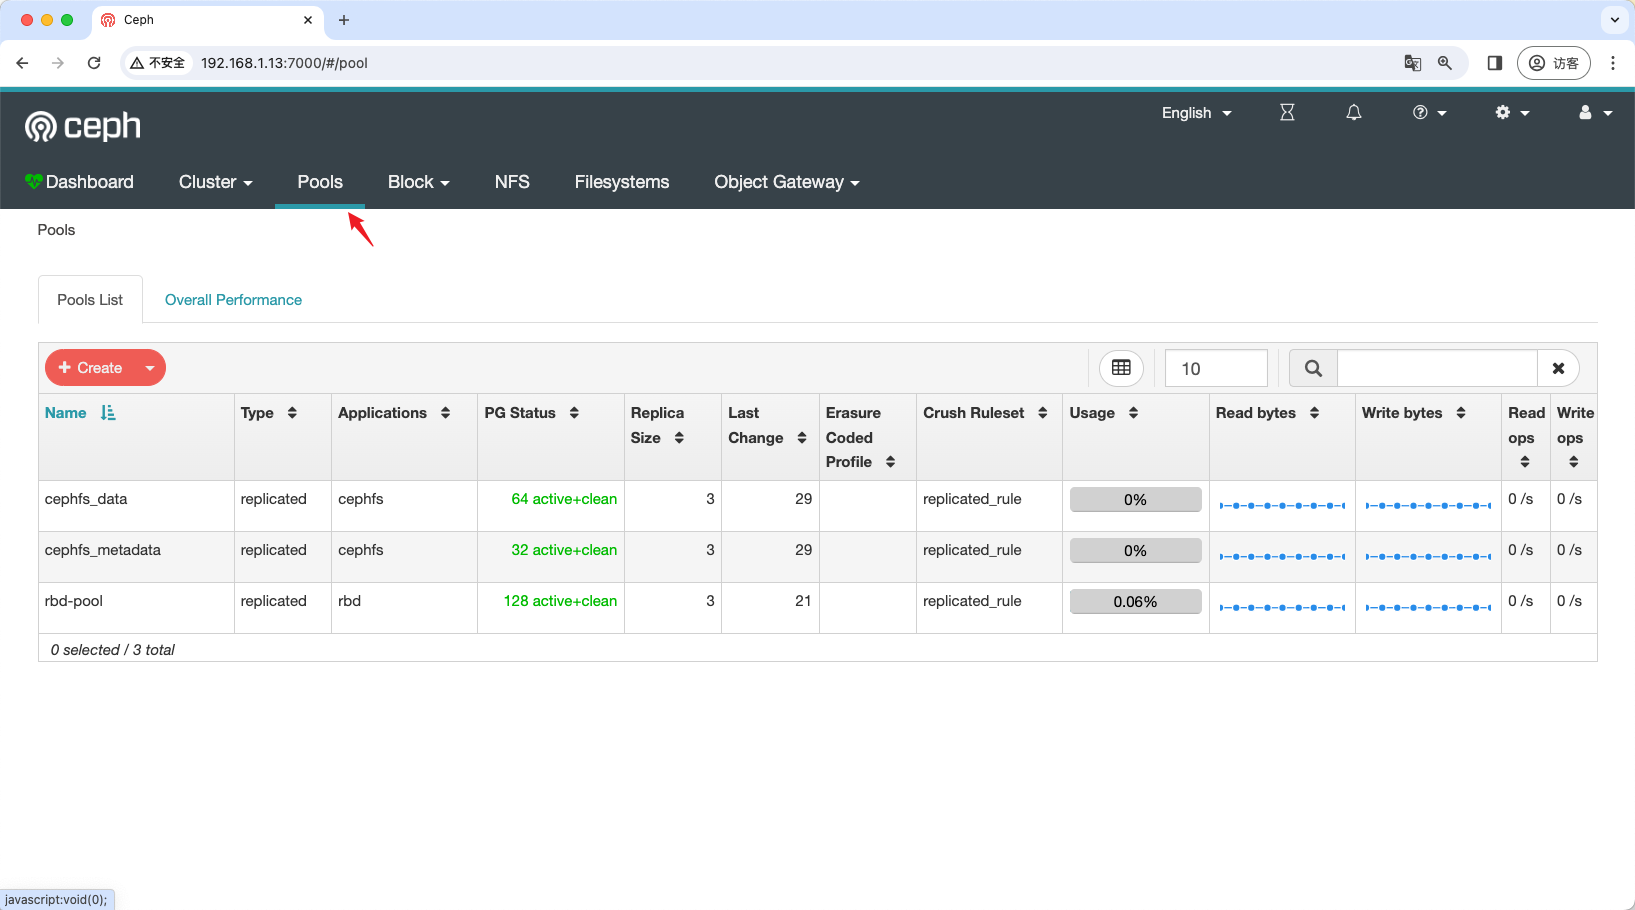
可以在dashboard创建pool

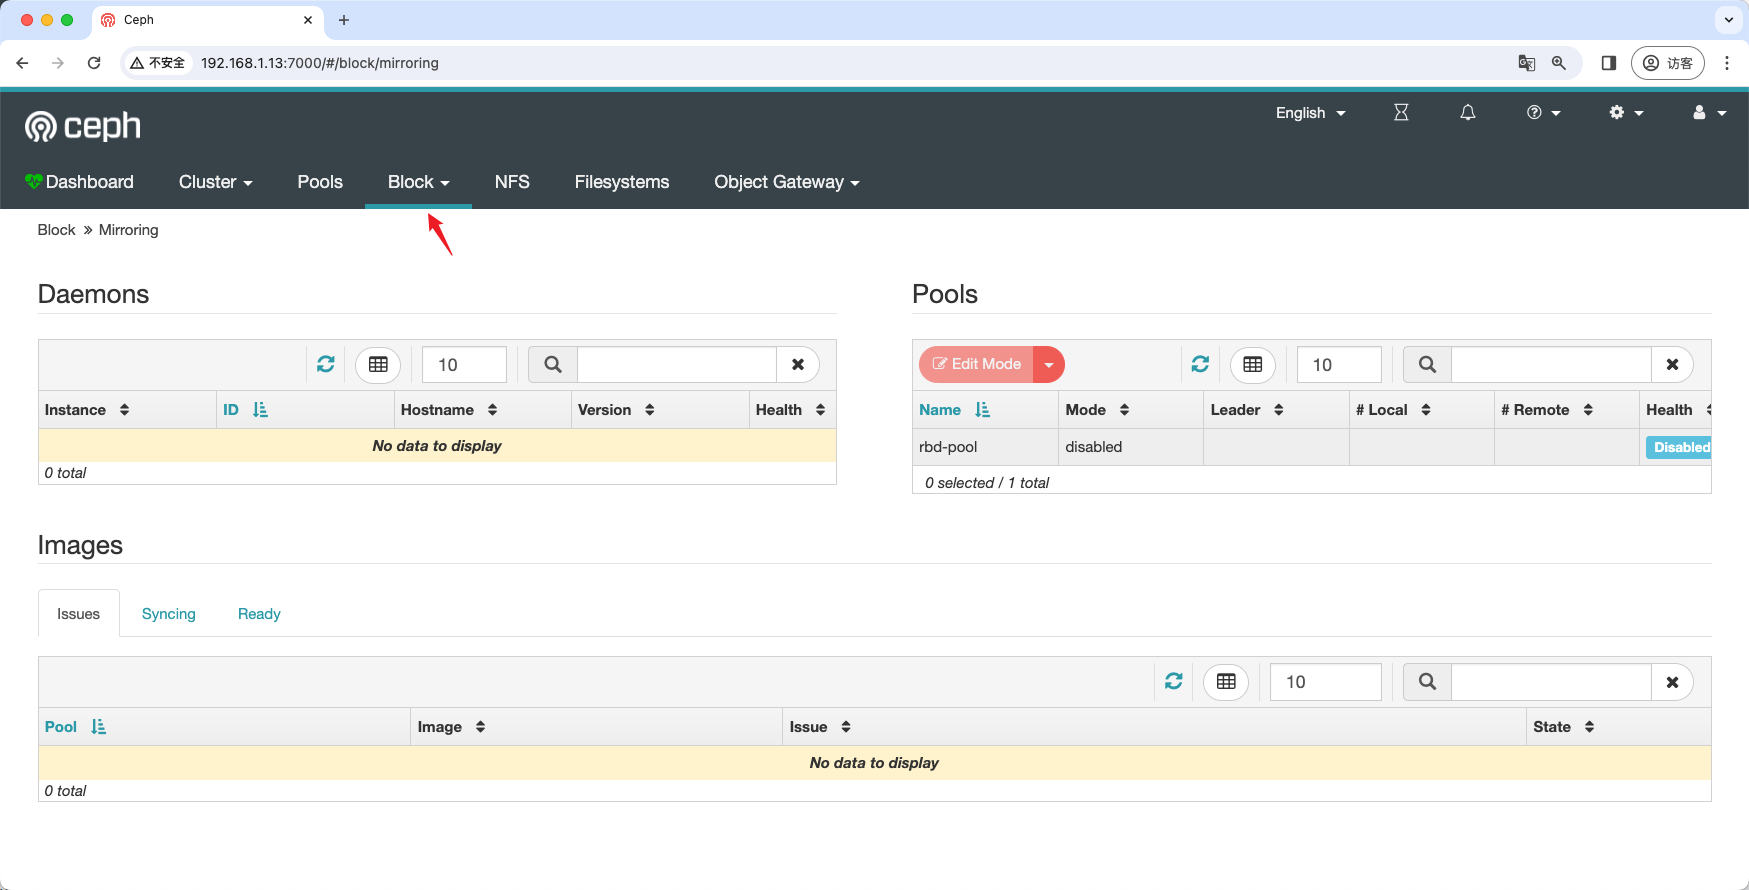
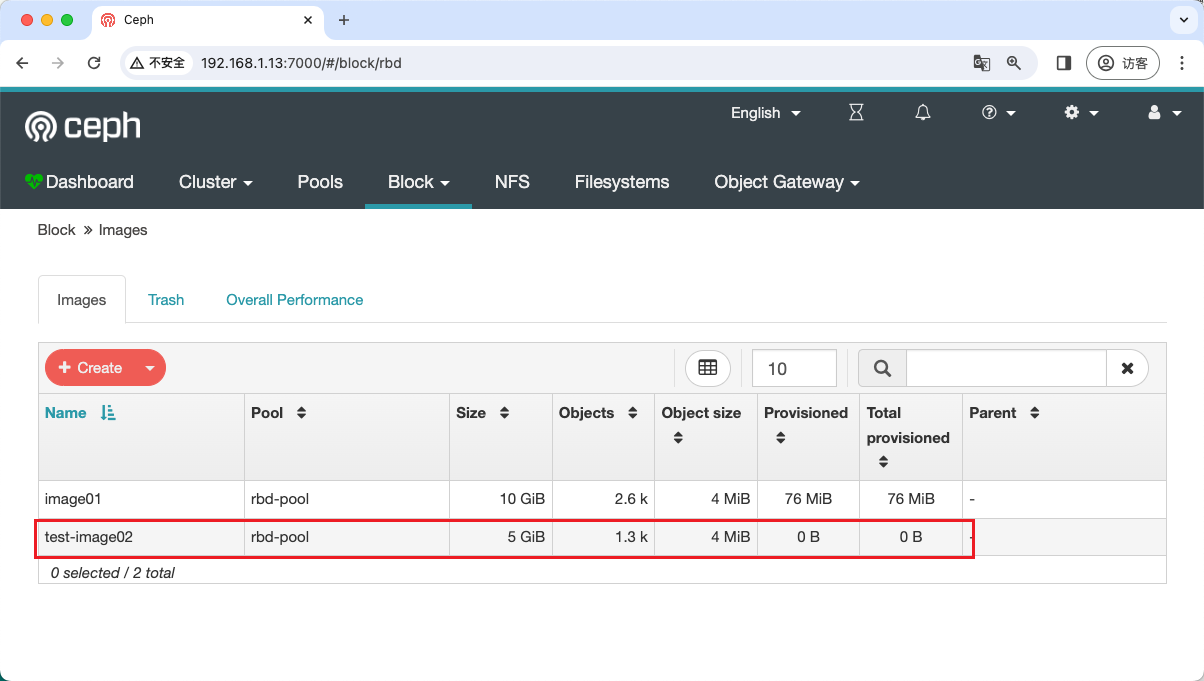
块信息
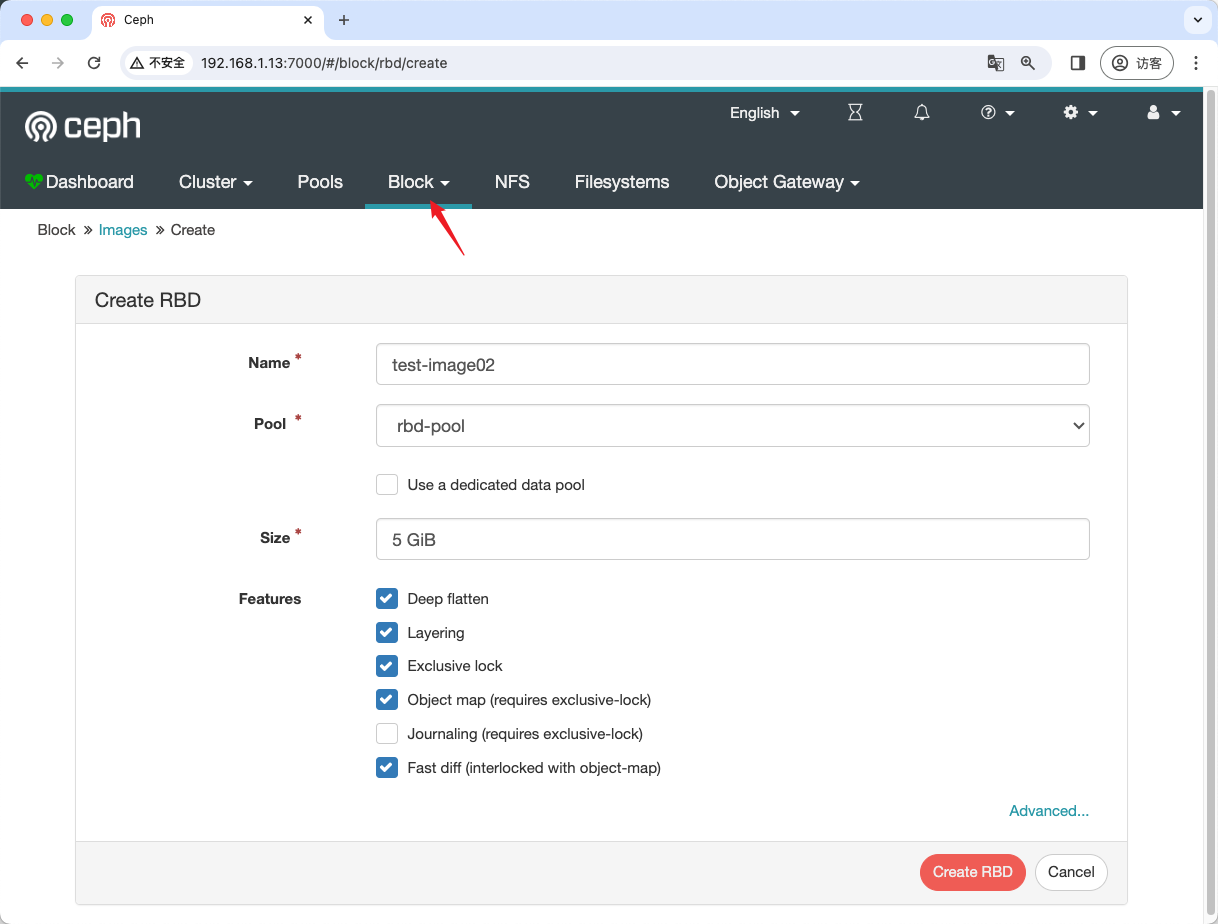
可以创建一个块设备
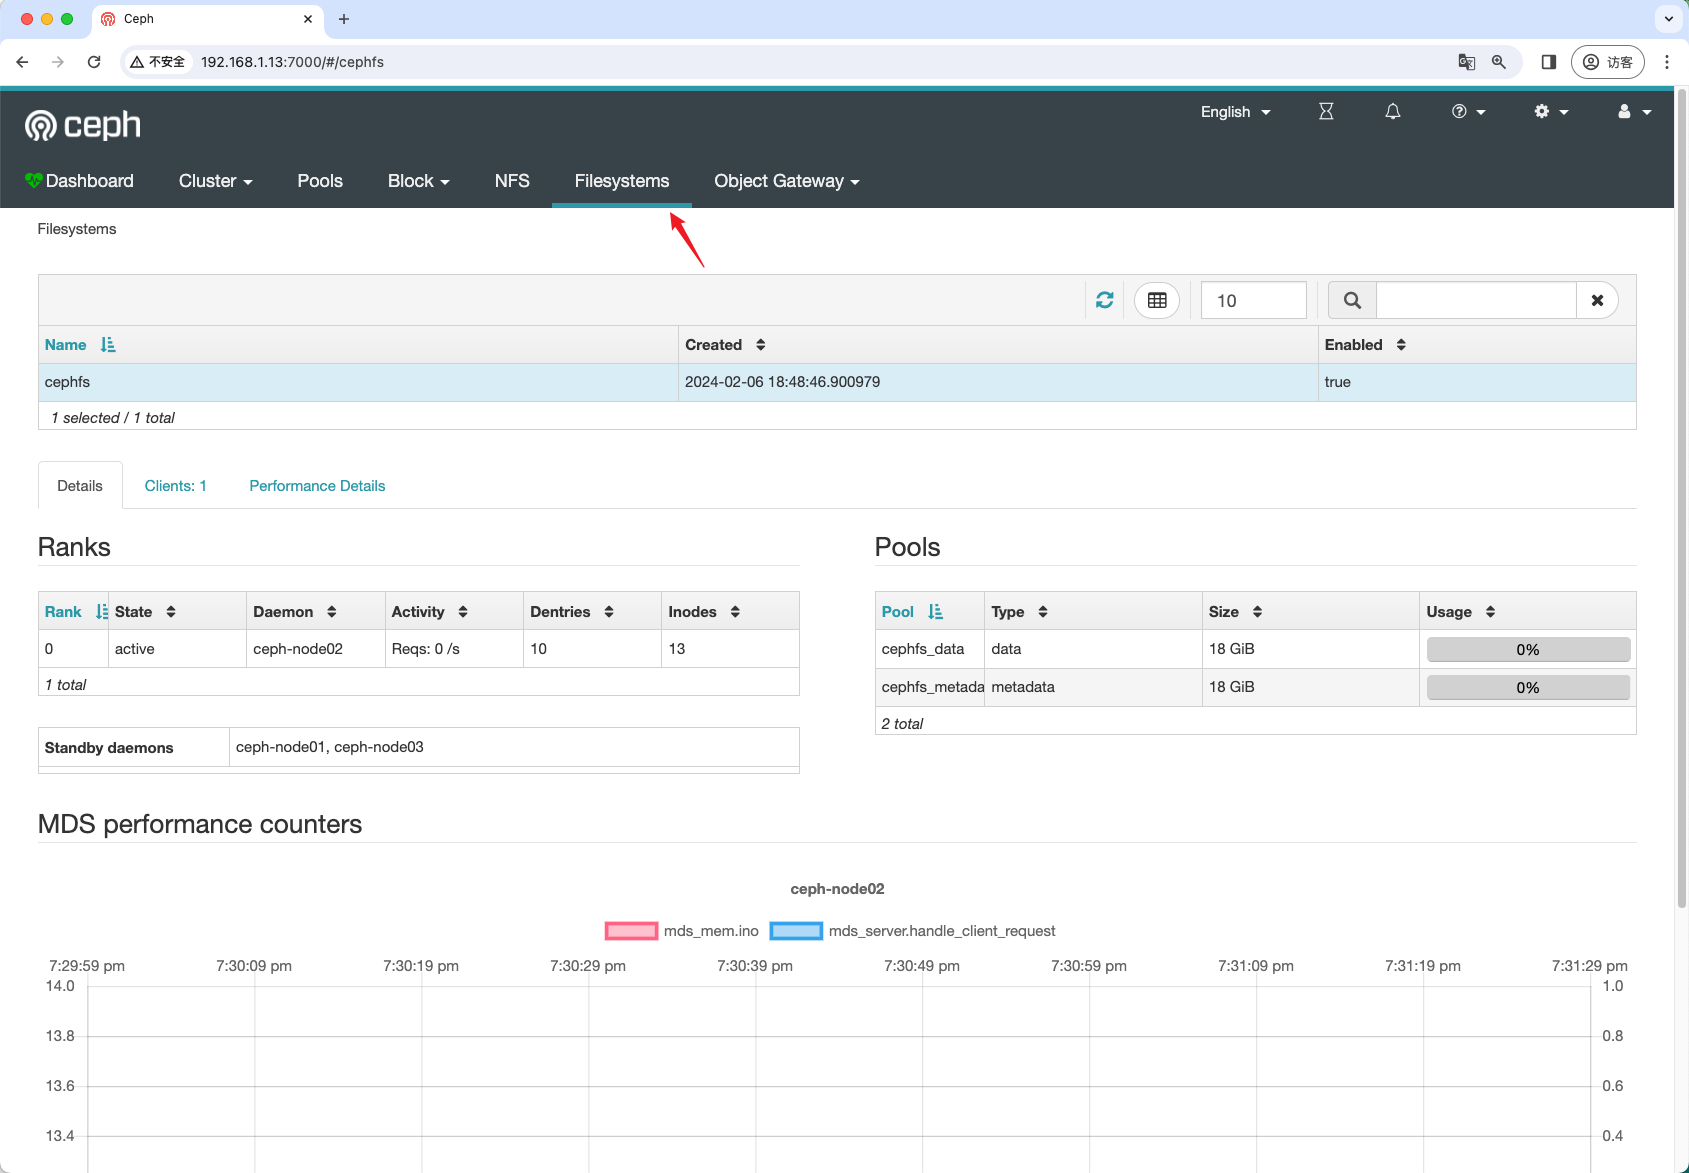
文件系统信息
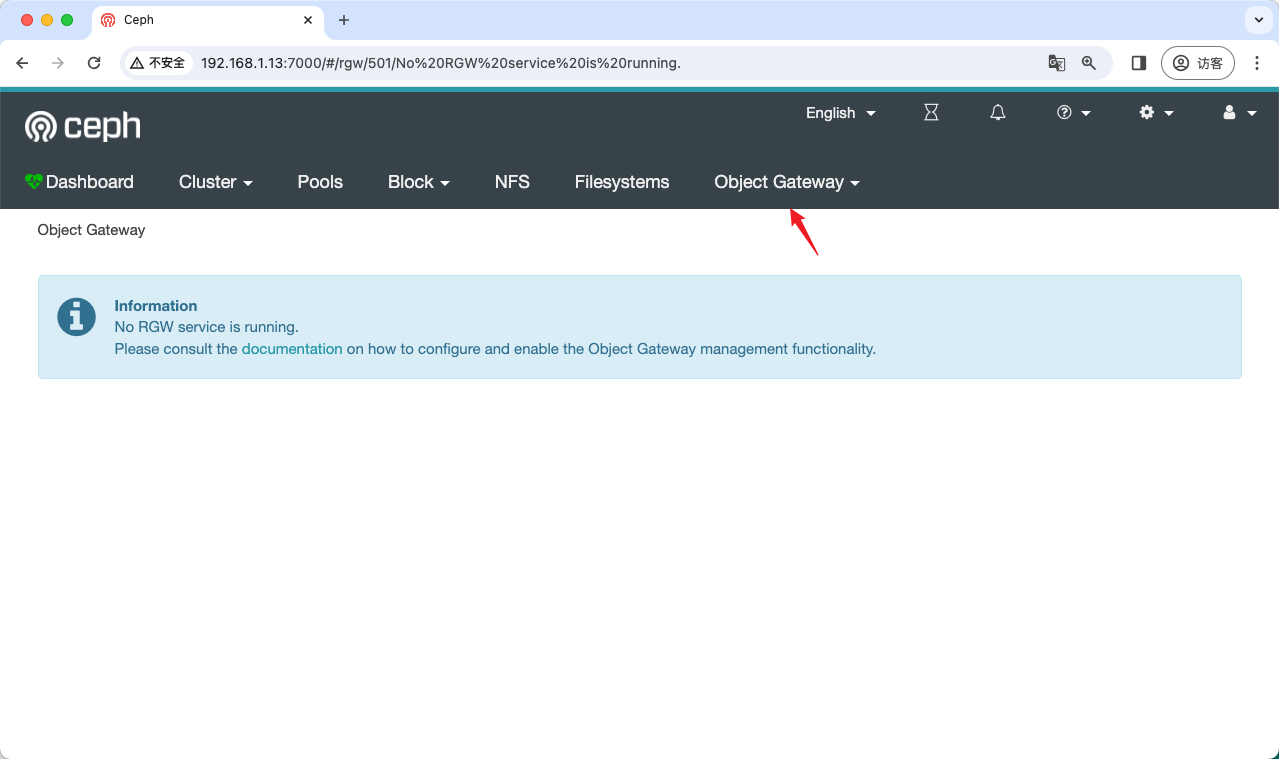
对象存储信息
Prometheus+Grafana监控Ceph
Prometheus(普罗米修斯):容器监控系统。官网:https://prometheus.io
Grafana:是一个开源的度量分析和可视化系统。官网:https://grafana.com/grafana
# 1、Docker部署Prometheus+Grafana
wget http://mirrors.aliyun.com/docker-ce/linux/centos/docker-ce.repo -O /etc/yum.repos.d/docker-ce.repo
yum install docker-ce -y
systemctl start docker
systemctl enable docker
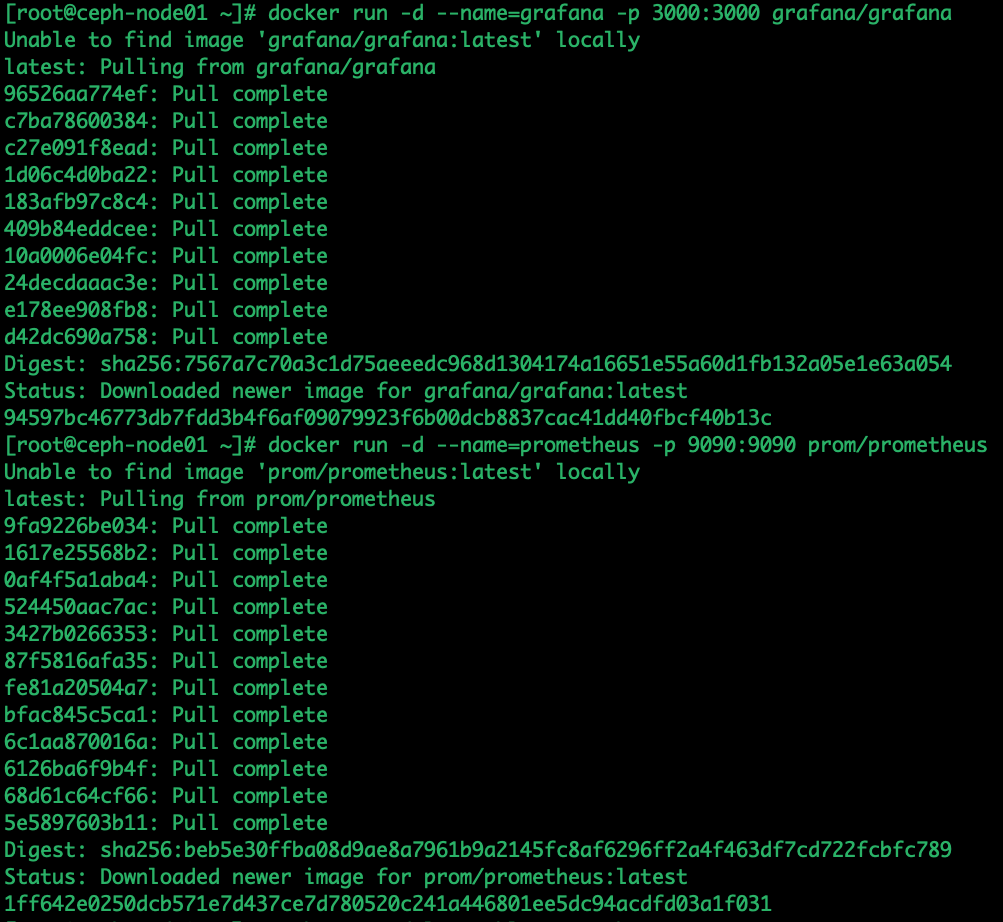
docker run -d --name=grafana -p 3000:3000 grafana/grafana
docker run -d --name=prometheus -p 9090:9090 prom/prometheus
# 2、启用MGR Prometheus插件
ceph mgr module enable prometheus
# 测试promtheus指标接口
curl 127.0.0.1:9283/metrics
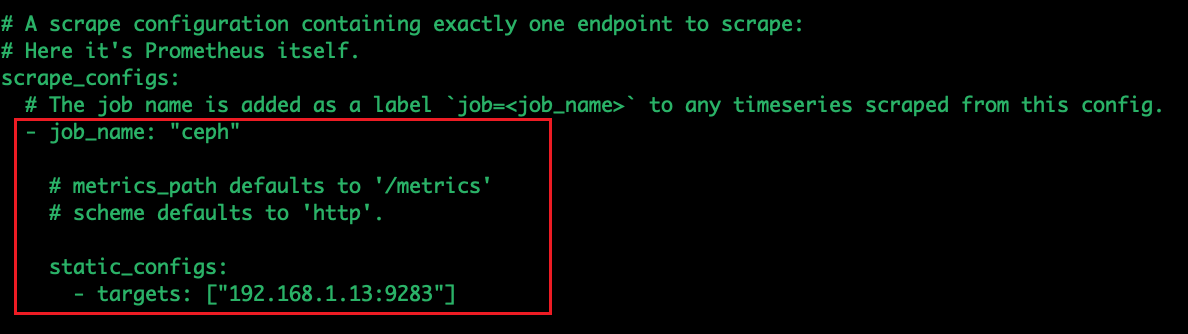
# 3、配置Prometheus采集
docker exec -it prometheus sh
vi /etc/prometheus/prometheus.yml
# =======================================
scrape_configs:
# The job name is added as a label `job=<job_name>` to any timeseries scraped from this config.
- job_name: "ceph"
# metrics_path defaults to '/metrics'
# scheme defaults to 'http'.
static_configs:
- targets: ["192.168.1.13:9283"]
# =======================================
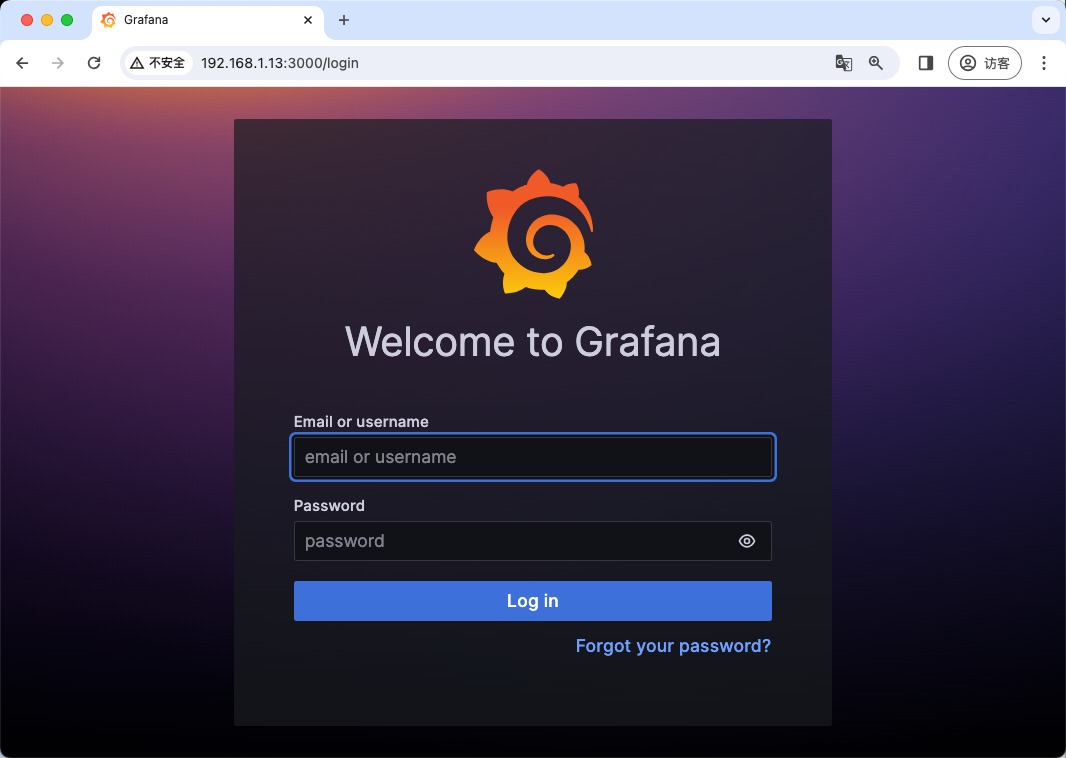
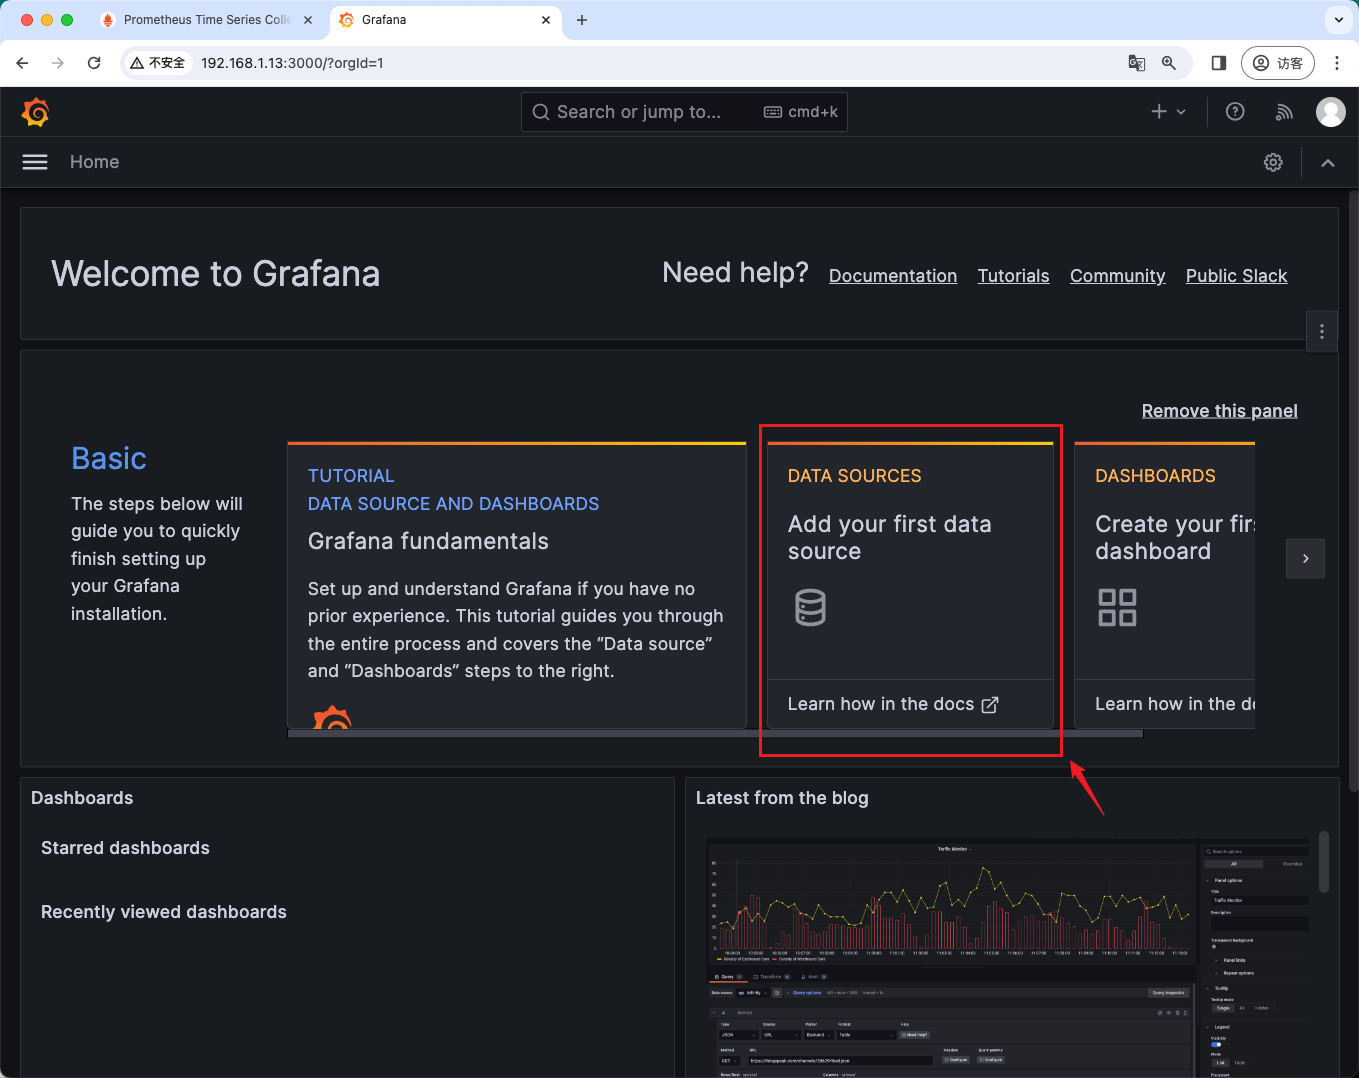
# 4、访问Grafana仪表盘
http://IP:3000
默认用户名密码均为admin
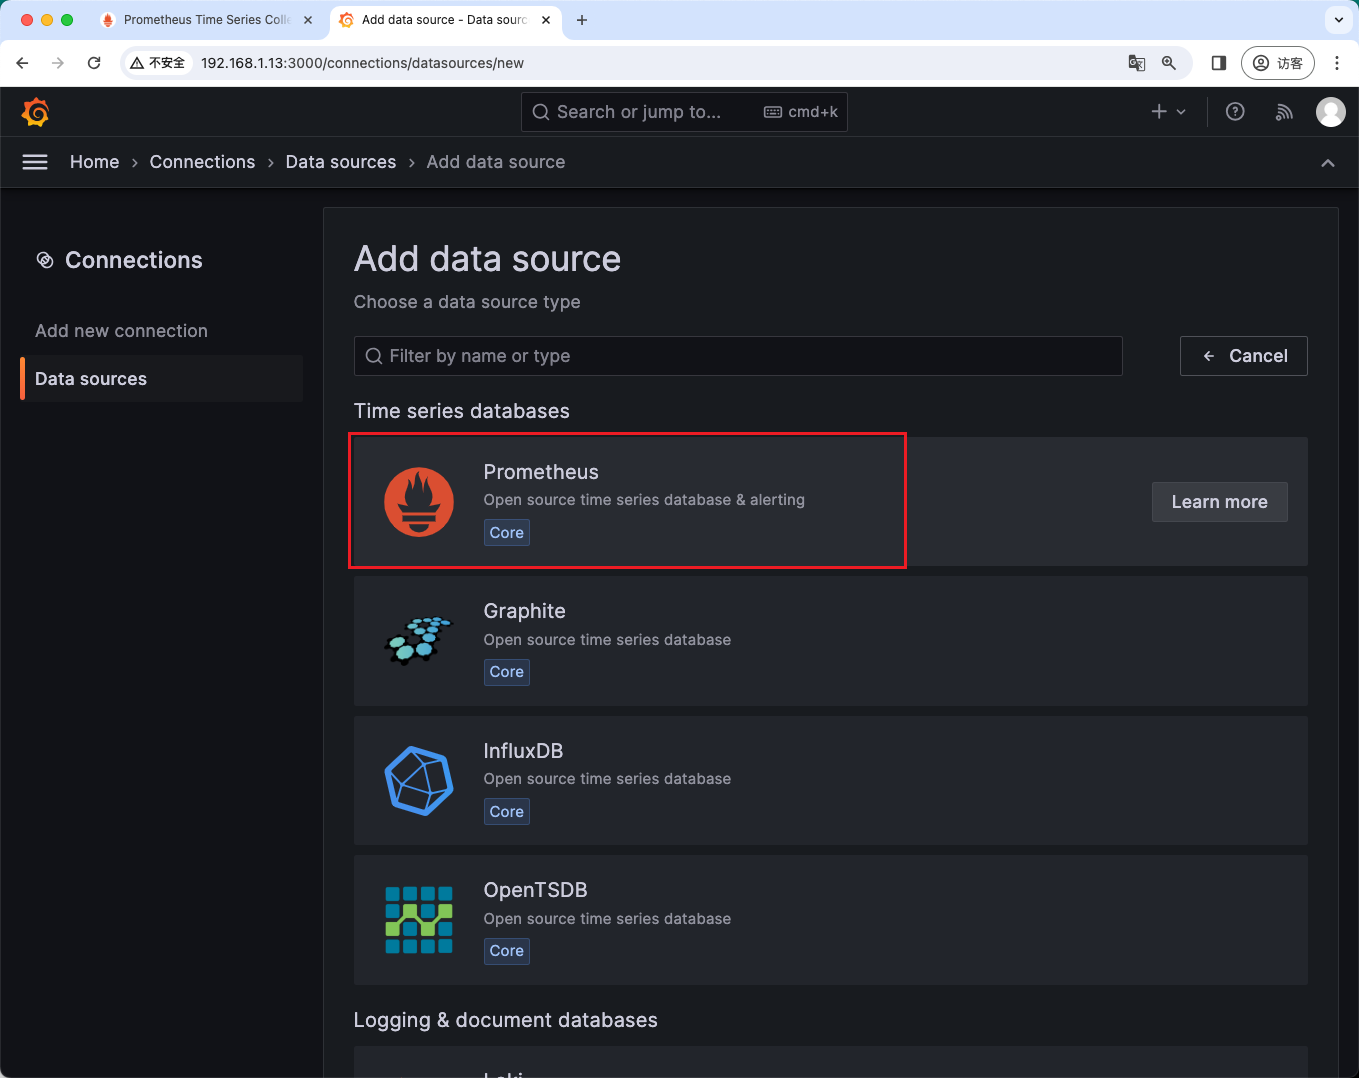
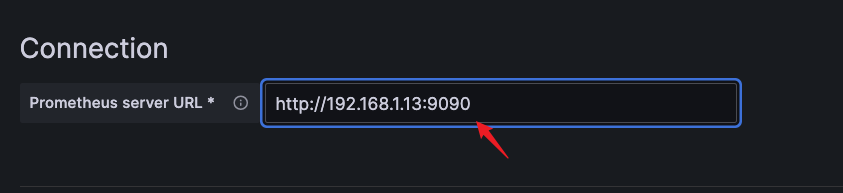
1.添加Prometheus为数据源:Configuration -> Data sources -> Promethes -> 输入URL http://IP:9090
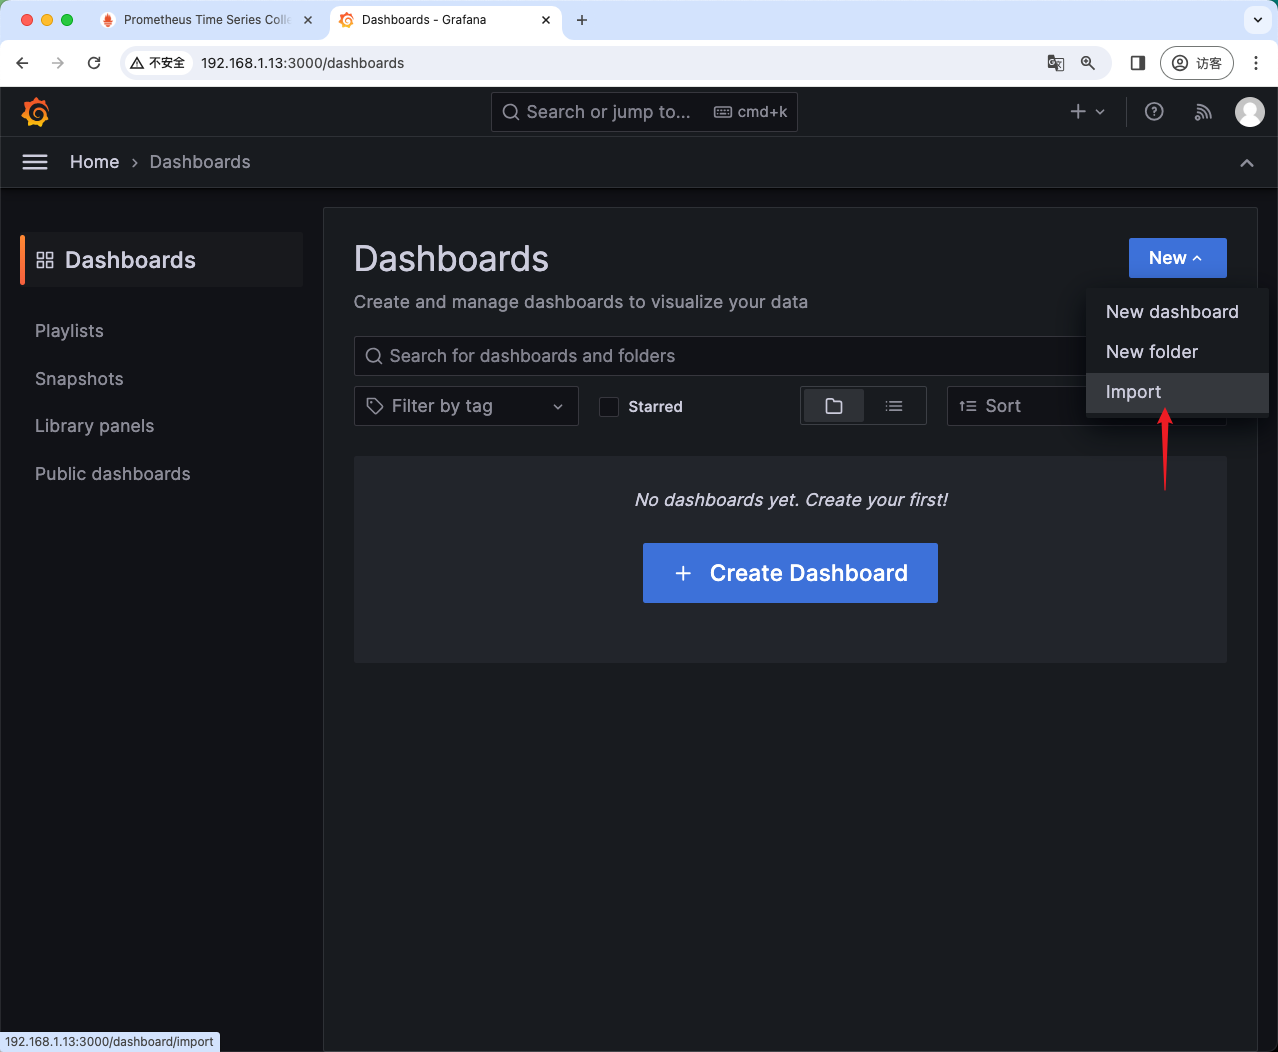
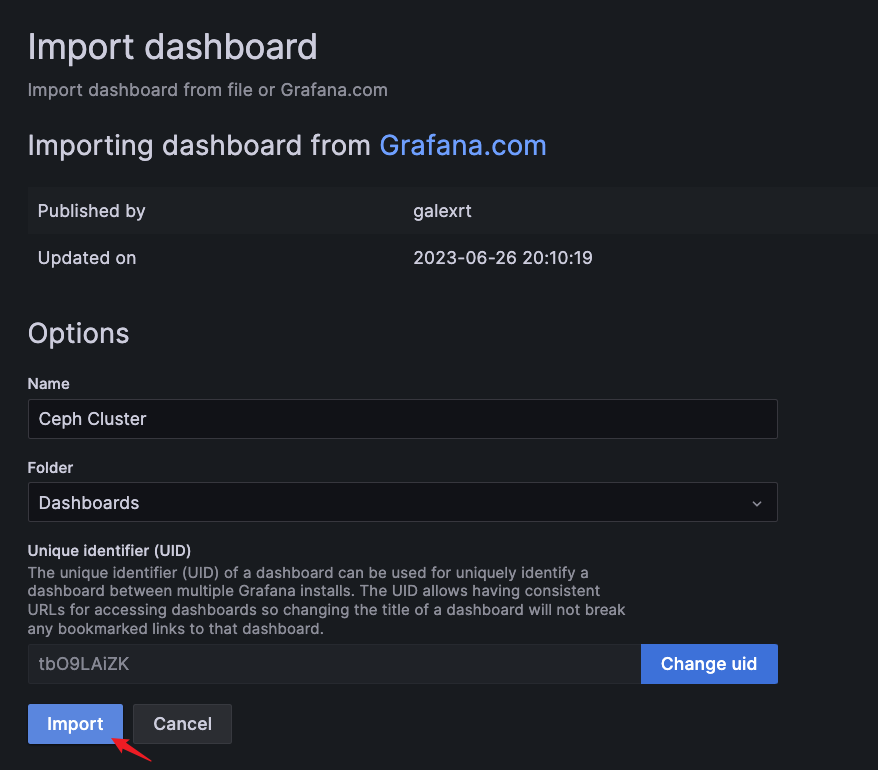
2.导入Ceph监控仪表盘:Dashboards -> Manage -> Import -> 输入仪表盘ID,加载
•Ceph-Cluster ID:2842
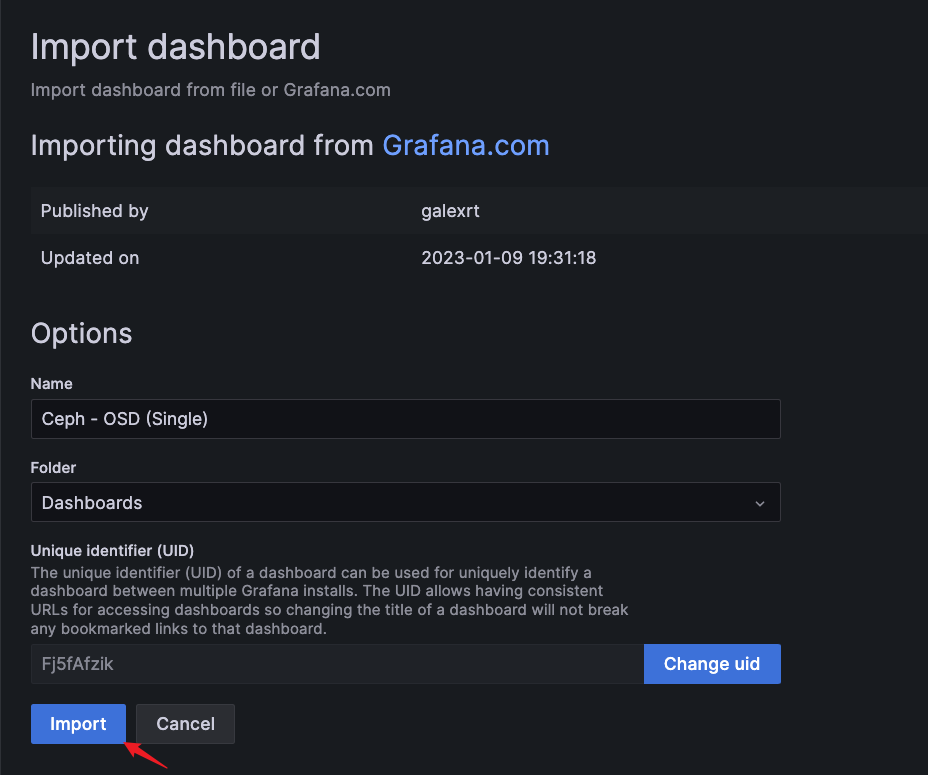
•Ceph-OSD ID:5336
•Ceph-Pool ID:5342上述过程:
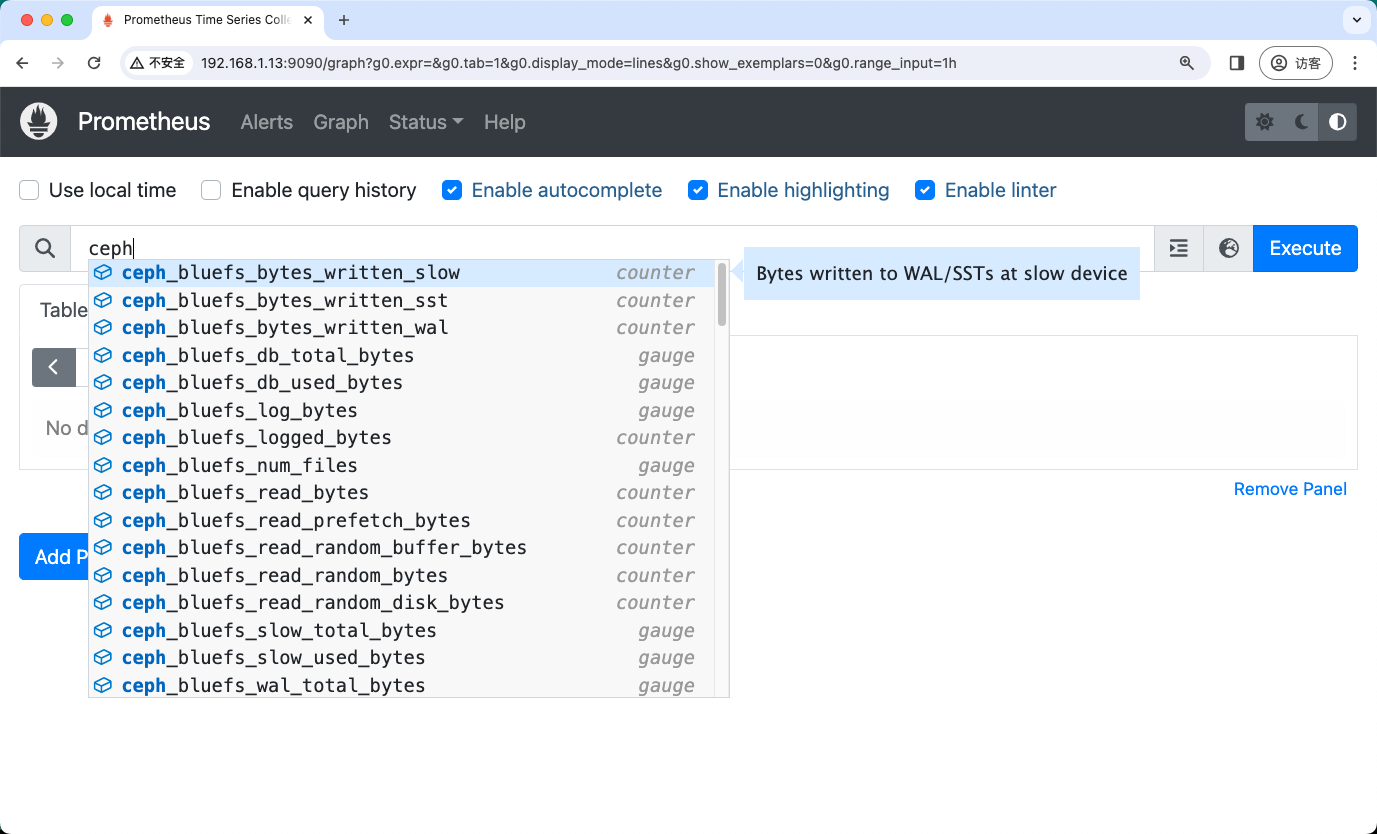
确定grafana和prometheus网站界面均为正常:
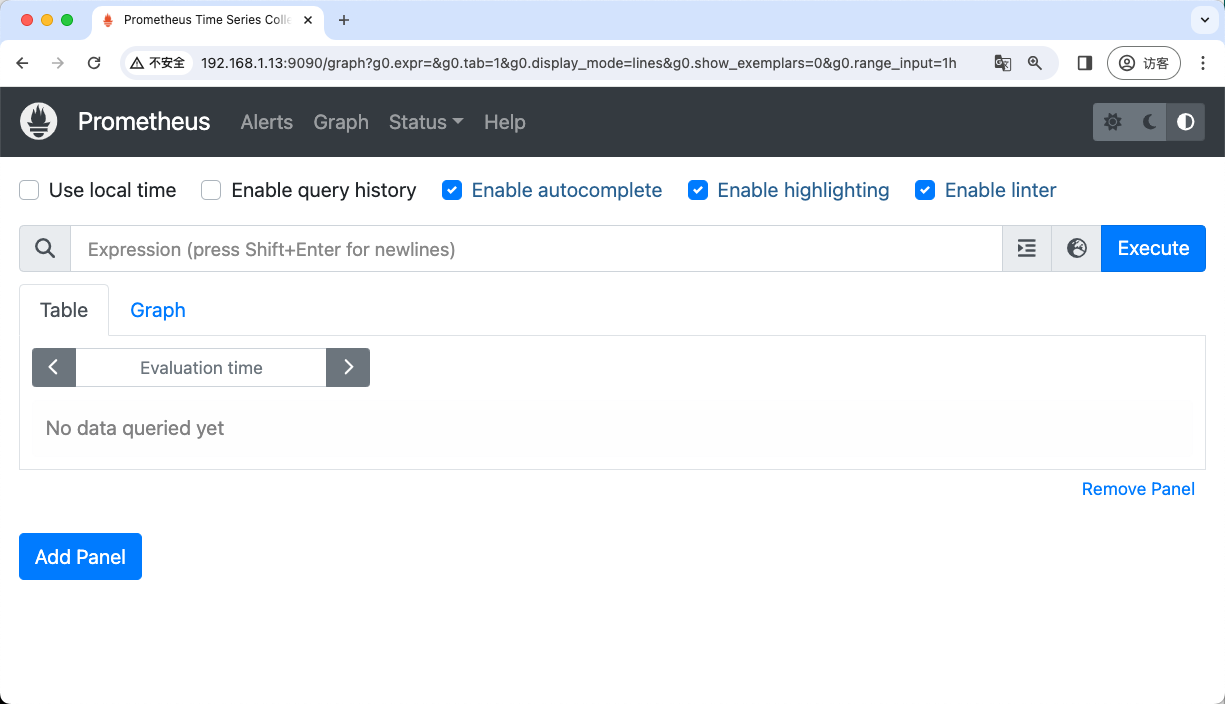
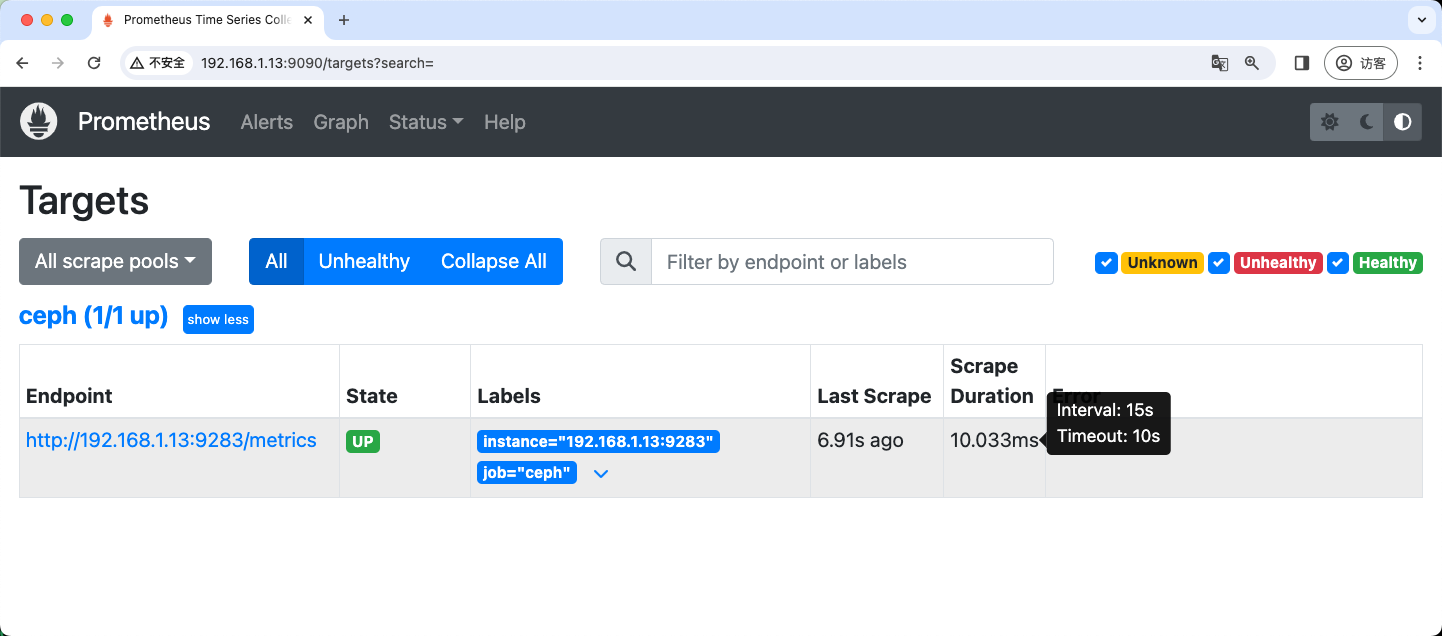
正常获取到监控指标:

配置Prometheus采集
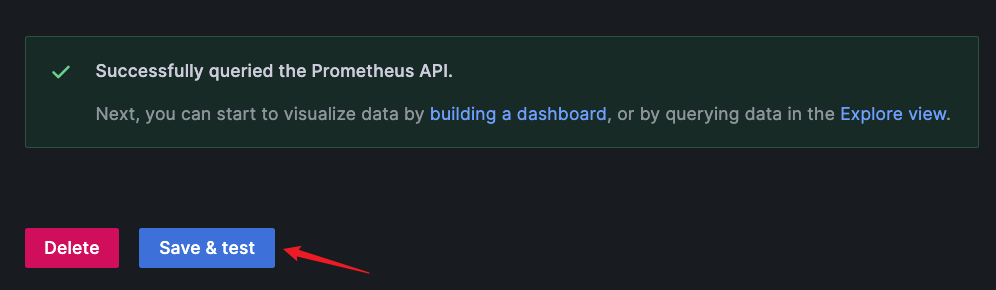
成功获取到指标
进入grafana,默认用户名和密码都是admin
配置数据源
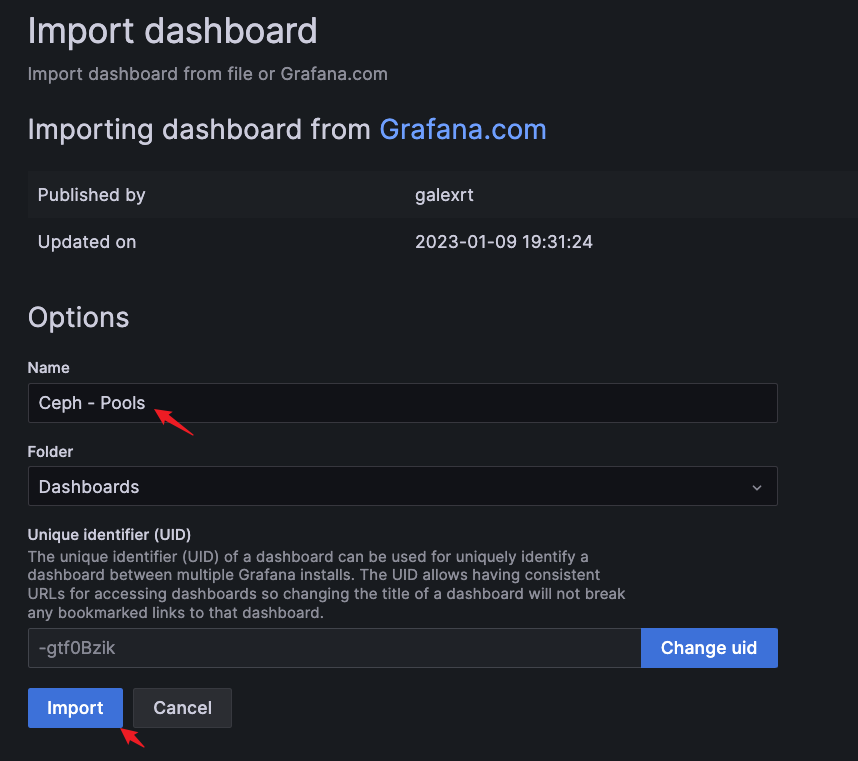
导入模版:
Ceph-Cluster ID:2842
Ceph-OSD ID:5336
Ceph-Pool ID:5342
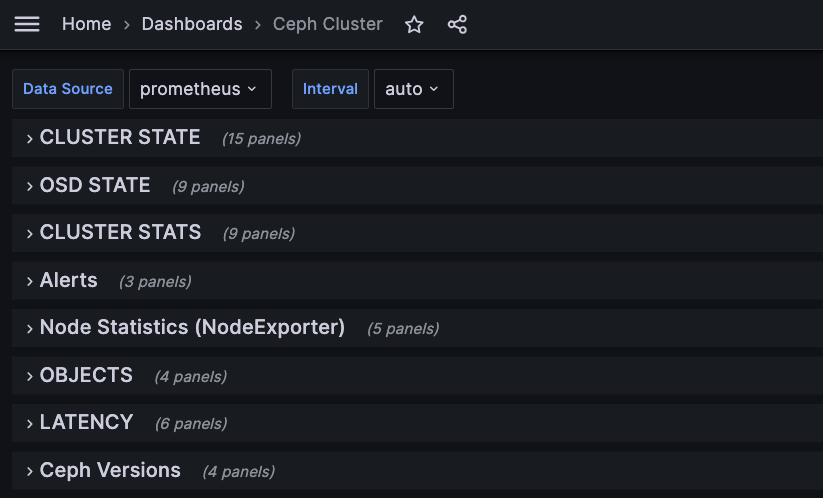
目前有三个仪表盘,先看Ceph-Cluster:
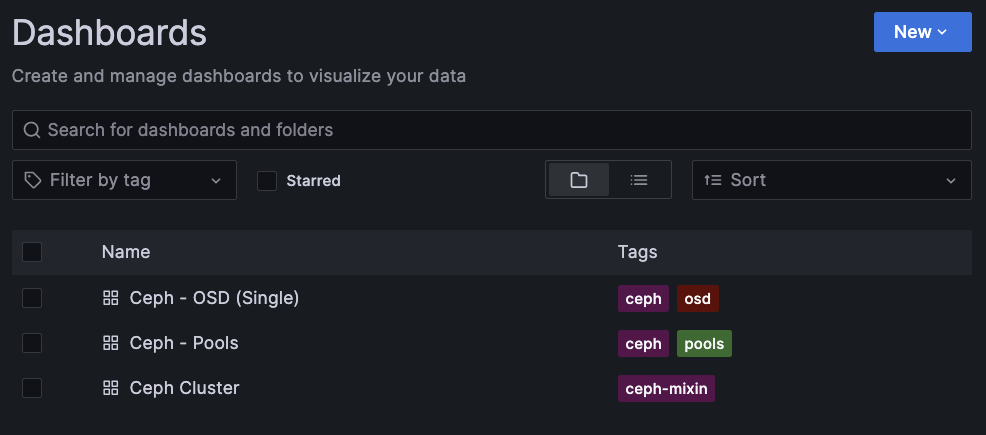
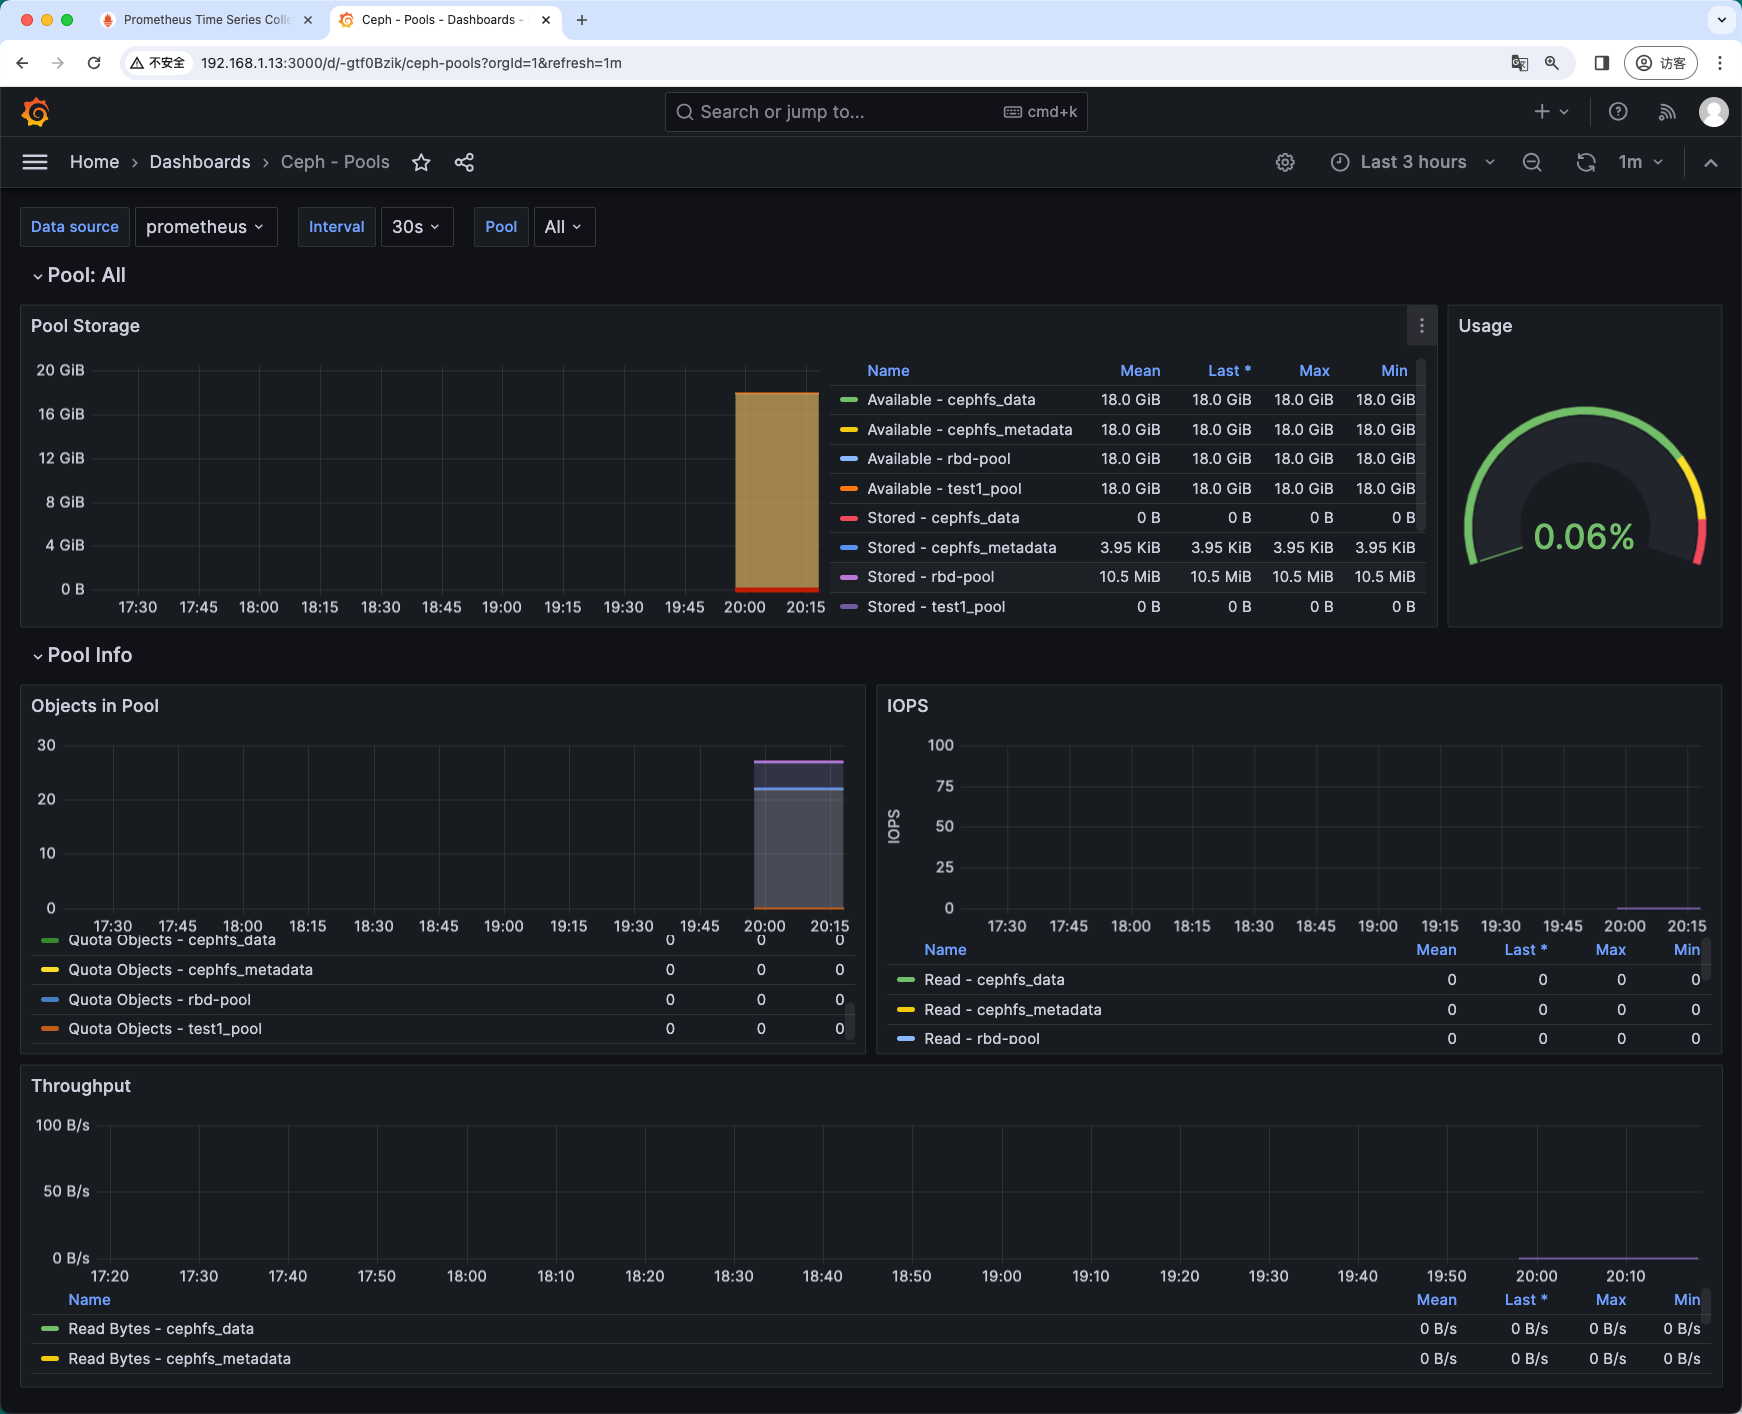
看下ceph-pool
ceph-osd
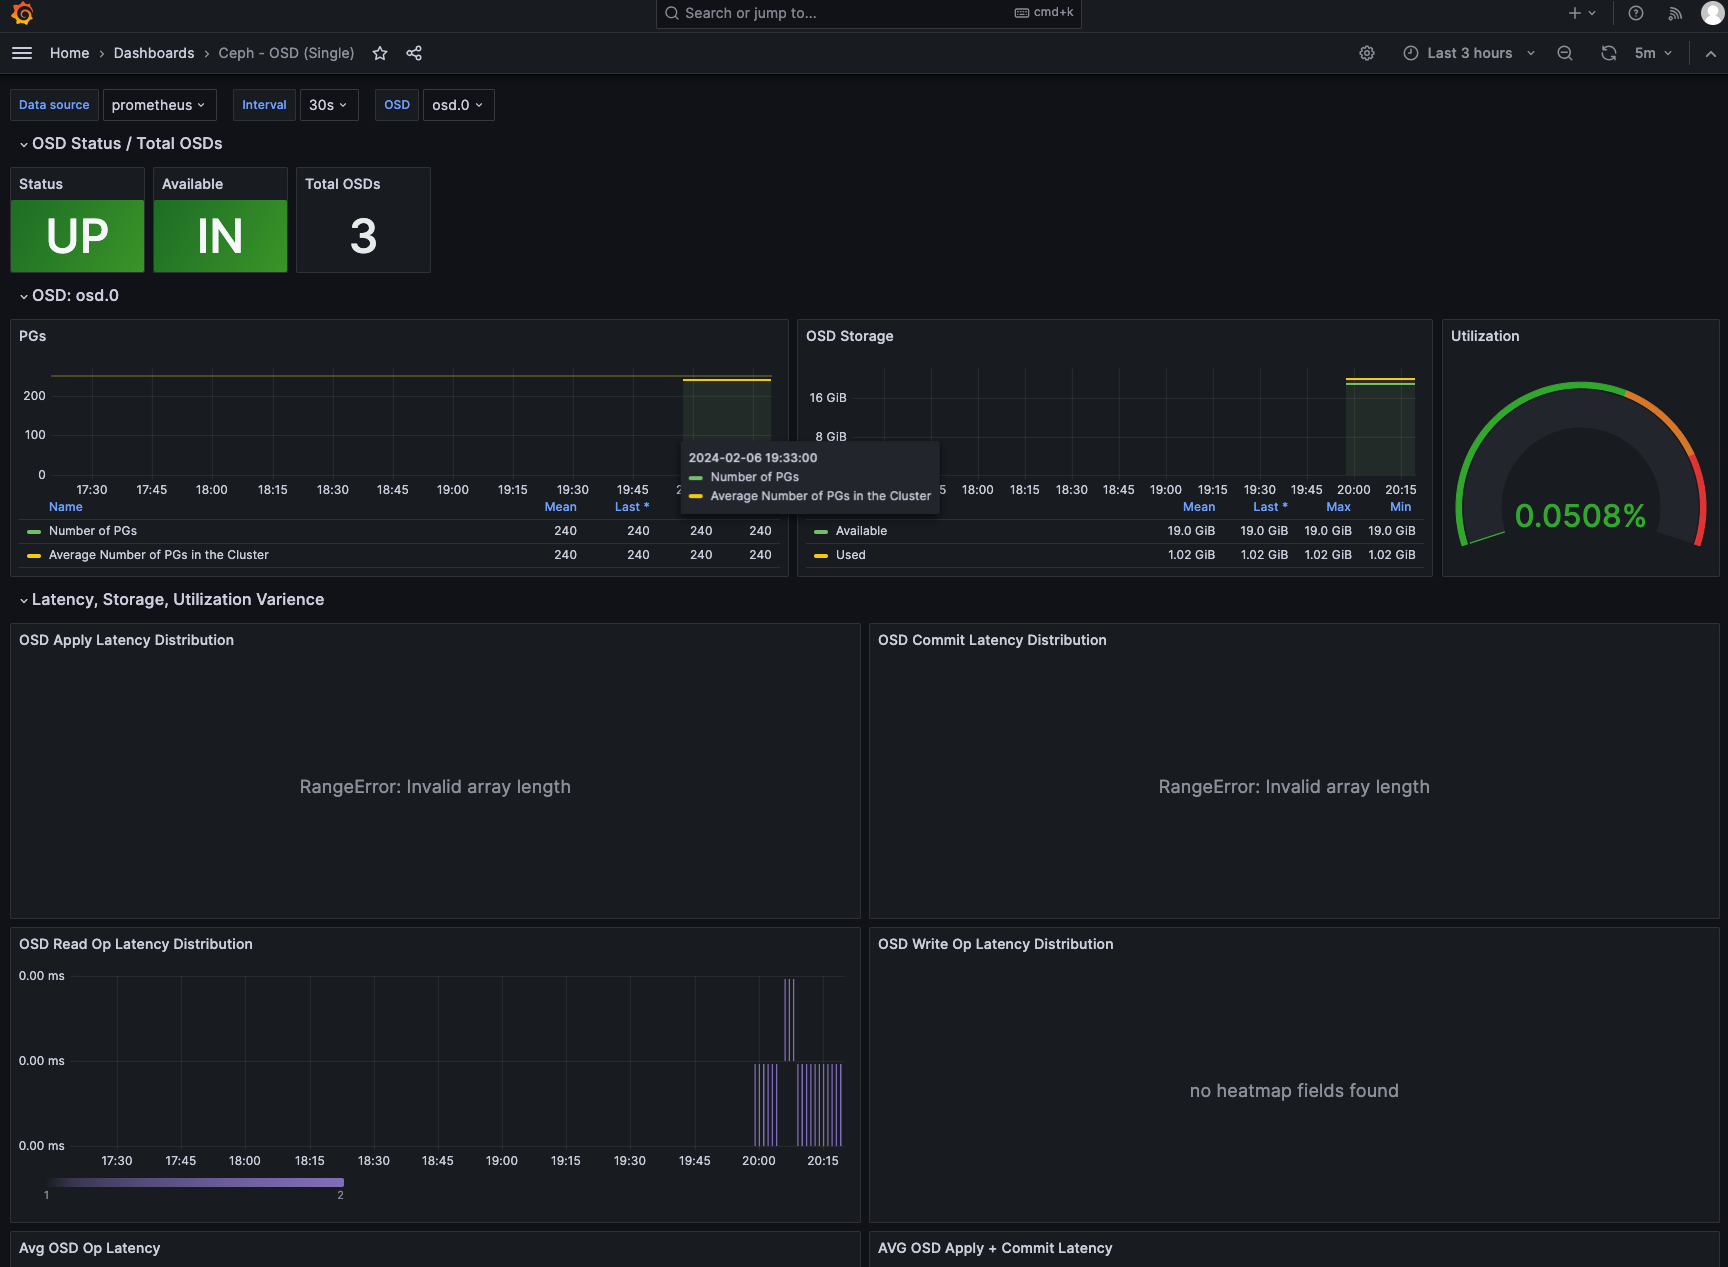
有些数据不兼容,可以修改相应数据配置仪表盘匹配prometheus相应指标
发布者:LJH,转发请注明出处:https://www.ljh.cool/40687.html